
The histogram shows the marks of 350 students of class 10 in a Science test.
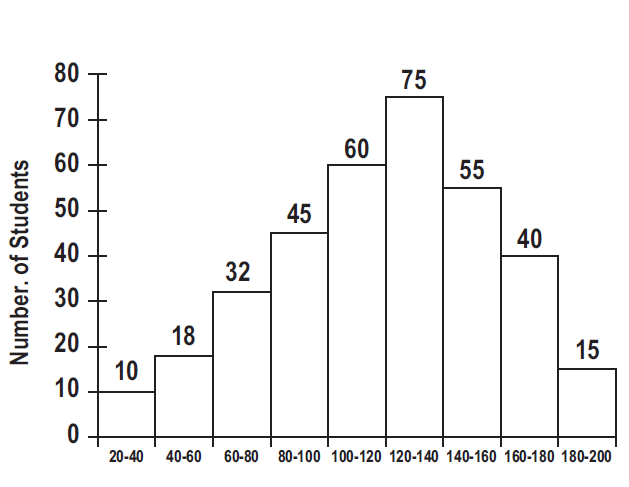
What is the ratio of the number of students who scored 140 marks or more to the number of students who scored 60 marks or more but less than 120 marks?
Answer & explanation
Correct answer: option 3
The correct answer is Option (3) → 110 : 137
Each bar gives the number of students in one class of marks, so a range of marks is the sum of the bars it covers.
140 or more: classes 140-160, 160-180, 180-200 \(=55+40+15=110\)
60 or more but less than 120: classes 60-80, 80-100, 100-120 \(=32+45+60=137\)
Ratio \(=110:137\) (no common factor)