CUET Preparation Today
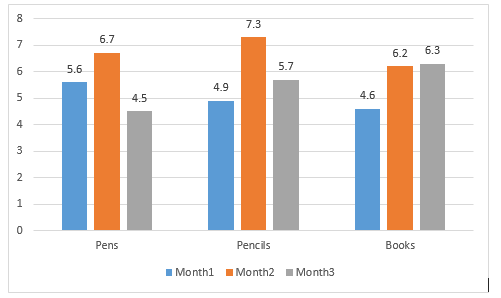
The following chart shows the sales (in thousands) of pens, pencils and books in month1, month2 and month3. Answer the question based on the chart.
Which product has the highest percentage of sales, and in which month (among all months) ? |
Pencils; Month 3 Pens; Month 1 Pencils; Month 2 Books; Month 3 |
Books; Month 3 |
Lets solve one by one for each option. 1. Pencils; Month 3 Total sale of pencils = 6.7 + 7.3 + 6.2 = 20.2 Sale of pencils in month 3 = 6.2 Percentage of sale of pencils in month 3 = \(\frac{6.2 }{20.2}\) × 100 = 30.69% 2. Pens; Month 1 Total sale of pens = 5.6 + 4.9 + 4.6 = 15.1 Sale of pens in month 1 = 5.6 Percentage of sale of pens in month 1 = \(\frac{5.6}{15.1}\) × 100 = 37.08% 3. Pencils;month 2 Total sale of pencils = 6.7 + 7.3 + 6.2 = 20.2 Sale of pencils in month 2 = 7.3 Percentage of sale of pencils in month 2 = \(\frac{7.3 }{20.2}\) × 100 = 36.13% 4. Books ; month 3 Total sale of books = 4.5 + 5.7 + 6.3 = 16.5 Sale of books in month 3 = 6.3 Percentage of sale of books in month 3 = \(\frac{6.3 }{16.5}\) × 100 = 38.18% So , Books ; month 3 has highest percentage of sale. |