CUET Preparation Today
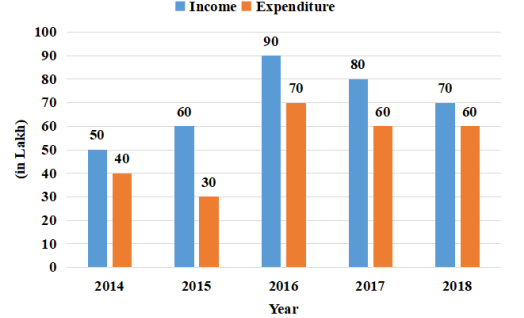
The following bar charts provides information on the income and the expenditure of a company in five consecutive years from 2014 to 2018.
Find the difference between the profits made by the company in the years 2015 to 2017 .
|
₹10 lakhs ₹12 lakhs ₹5 lakhs ₹15 lakhs |
₹10 lakhs |
Profit in year 2015 = 60 - 30 = 30 Profit in 2017 = 80 - 60 = 20 Difference in profit in year 2015 & 2017 = 30 - 20 = 10 lakh |