CUET Preparation Today
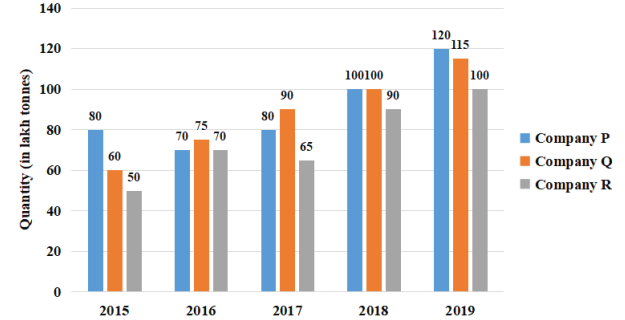
The given bar graph indicates the production of sugar (in lakh tonnes) by three different sugar companies P, Q and R from the year 2015 to 2019. Study the bar graph and answer the question that follows. Production of sugar by companies P, Q and R from 2015 to 2019
The ratio of the average production of sugar by company P from the year 2015 to 2019 to the average production of sugar by company R from the year 2015 to 2019 is: |
6 : 5 7 : 6 8 : 5 7 : 5 |
6 : 5 |
Average production of sugar by company P from the year 2015 to 2019 : Average production of sugar by company R from the year 2015 to 2019 ( \(\frac{80+70+80+100+120 }{5}\) ) : ( \(\frac{50+70+65+90+100 }{5}\) ) 6 : 5 |