CUET Preparation Today
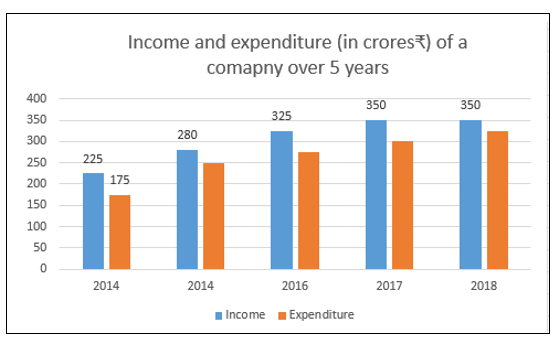
The given bar graph shows the income and expenditure (in crores ₹) of a company over 5 years, from 2014 to 2018. Study the bar graph and answer the question that follows.
In which of the following years is the ratio of expenditure to income the minimum? |
2016 2017 2018 2014 |
2014 |
Ratio of expenditure to income in 2014 = \(\frac{175}{225}\) = \(\frac{7}{9}\) = 0.778 Ratio of expenditure to income in 2016 = \(\frac{275}{325}\) = \(\frac{11}{13}\) = 0.846 Ratio of expenditure to income in 2017 = \(\frac{300}{350}\) = \(\frac{6}{7}\) = 0.89 Ratio of expenditure to income in 2018 = \(\frac{325}{350}\) = \(\frac{13}{14}\) = 0.928 So , Ratio of expenditure to income in 2014 is minimum. |