CUET Preparation Today
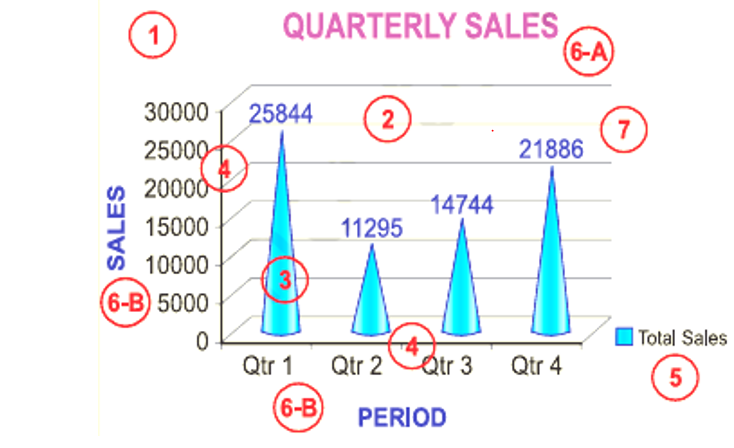
What does Number 4 depict in the above figure? |
The chart area The data points The horizontal (category) and vertical (value) axis The plot area |
The horizontal (category) and vertical (value) axis |
The correct answer is option 3- The horizontal (category) and vertical (value) axis. The horizontal (category) and vertical (value) axis is depicted at number 4 in the given figure. The horizontal (category) and vertical (value) axis: The x-axis is usually the horizontal line which contains categories (independent values or categories) and y-axis is usually the verticals which contains data (dependent values).
|