
The given figure shows the variation of electric potential V as a function of distance x.
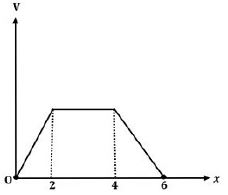
The graph for the variation of electric field E as a function of distance x is:
Answer & explanation
Correct answer: option 2
The correct answer is Option (2) →
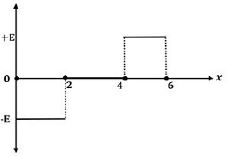
$E=-\frac{dV}{dx}.$
$0\le x\le2:\;V\text{ increases linearly } \Rightarrow \frac{dV}{dx}>0.$
$E=\text{constant negative.}$
$2\le x\le4:\;V=\text{constant } \Rightarrow \frac{dV}{dx}=0.$
$E=0.$
$4\le x\le6:\;V\text{ decreases linearly } \Rightarrow \frac{dV}{dx}<0.$
$E=\text{constant positive.}$
$E(x)$ is constant negative for $0\le x\le2$, zero for $2\le x\le4$, and constant positive for $4\le x\le6$.