CUET Preparation Today
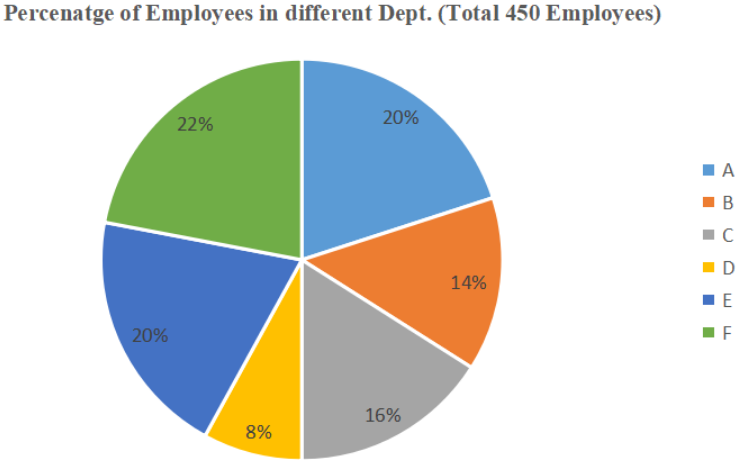
The given pie chart shows the percentage distribution of 450 employees in an organisation. Study the pie chart and answer the question that follows.
If 60% of the employees in department E are females, how many male employees are there in that department? |
54 36 72 18 |
36 |
20% = \(\frac{1}{5}\) & 40% = \(\frac{2}{5}\) Total number of employees in E = \(\frac{1}{5}\) × 450 = 90 Number of males in E are 60% . So , Number of females = \(\frac{2}{5}\) × 90 = 18 |