CUET Preparation Today
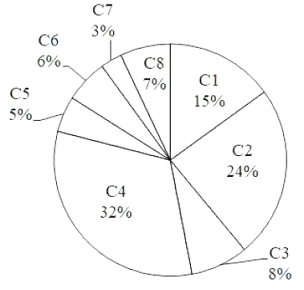
The pie chart given below shows the population of 8 cities in a year. Total population of all the 8 cities is 30,000. Population in a particular city is shown as a percent of total population in all these 8 cities.
What is the average population (approximately) of cities C3, C5 and C7? |
1200 1800 1600 2000 |
1600 |
Total population of C3 , C5 & C7 = (8% + 5% + 3%) of 30000 = 16% of 30000 = 4800 Average = \(\frac{4800}{3}\) = 1600 |