CUET Preparation Today
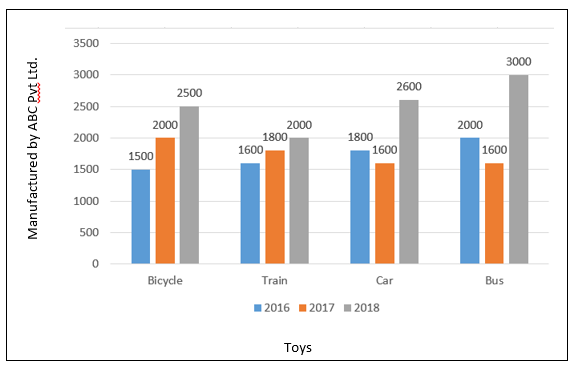
The Bar graph shows four different toys (Bicycle, Train, Car & Bus) manufactured by ABC Pvt Ltd. company in 3 consecutive years.
What is the ratio between the sum of cars and trains manufactured in 2017 and 2018 to the total number of buses manufactured in 2016, 2017 and 2018 together? |
30 : 41 33 : 40 35 : 41 40 : 33 |
40 : 33 |
Sum of cars and trains manufactured in 2017 & 2018 : Number of buses manufactured in 2016, 2017 and 2018 (2000 + 1600+ 1800 + 2600) : ( 2000 + 1600 + 3000 ) 8000 : 6600 40 : 33 |