
Given diagram is a Geometric Representation of Profit Maximisation (Short Run). Study the diagram given below and answer the question.
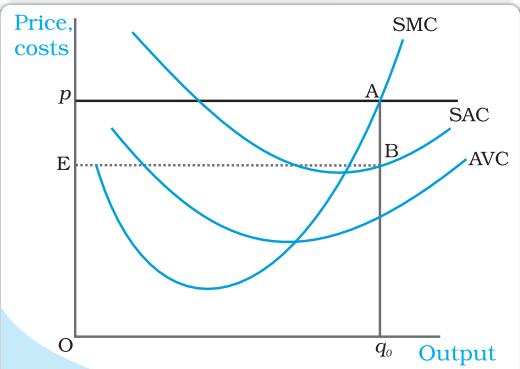
The horizontal line drawn at the height of the market price p in the diagram is:
Answer & explanation
Correct answer: option 4
The correct answer is Option (4) → the firm’s AR curve, which is also the demand curve facing it
A horizontal line at the market price p is the price line. Since AR equals the price at every output, it is the firm’s AR curve, and it is also the demand curve facing the firm.
Option (1) the market demand curve, which shows what all buyers wish to buy — Incorrect. The market demand curve slopes down. The flat line is only the demand facing one firm.
Option (2) the firm’s short run supply curve, which starts at the minimum of AVC — Incorrect. The supply curve is the rising part of SMC from the minimum AVC; it is not flat.
Option (3) the firm’s total revenue curve, which rises with output — Incorrect. The TR curve is a rising straight line from the origin. Its slope is p.
Option (4) the firm’s AR curve, which is also the demand curve facing it — Correct. AR = p at every output.
NCERT (2026-27): “4.2 Revenue … Now consider Figure 4.2. Here, we plot the average revenue or market price (y-axis) for different values of a firm’s output (x-axis). Since the market price is fixed at p, we obtain a horizontal straight line that cuts the y-axis at a height equal to p. This horizontal straight line is called the price line. It is also the firm’s AR curve under perfect competition The price line also depicts the demand curve facing a firm. Observe that the demand curve is perfectly elastic. This means that a firm can sell as many units of the good as it wants to sell at price p.” |