CUET Preparation Today
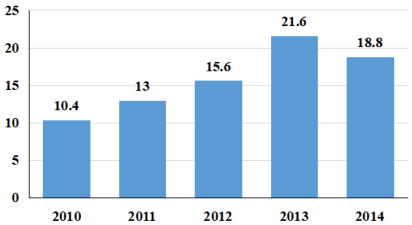
Study the given bar-graph and answer the question that follows. The bar-graph shows the export of rice (in ₹ lakh) during five years.
The average export of rice for the years 2010 to 2014 (in ₹ lakh) was: |
13.28 14.78 15.88 16.56 |
15.88 |
Average export of rice for rice 2010 to 2014 = \(\frac{10.4 + 13 + 15.6 + 21.6 + 18.8}{5}\) = \(\frac{ 79.4}{5}\) = 15.88 |