CUET Preparation Today
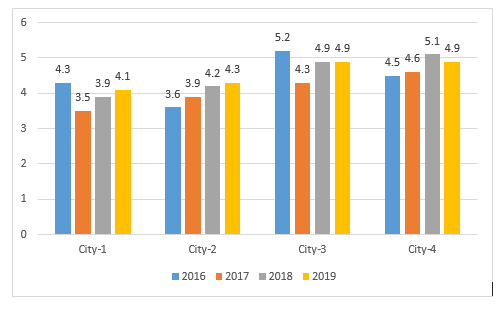
The following graph shows the sales of cars (in thousands) in four cities in 4 years. Study the graph and answer the question.
Which city has the highest sales?
|
City-1 City-3 City-4 City-2 |
City-3 |
Sale of city 1 = 4.3 + 3.5 + 3.9 + 4.1 = 15.8 Sale of city 2 = 3.6 + 3.9 + 4.2 + 4.3 = 16 Sale of city 3 = 5.2 + 4.3 + 4.9 + 4.9 = 19.3 Sale of city 4 = 4.5 + 4.6 + 5.1 + 4.9 = 19.1 Sale of city 3 is highest . |