CUET Preparation Today
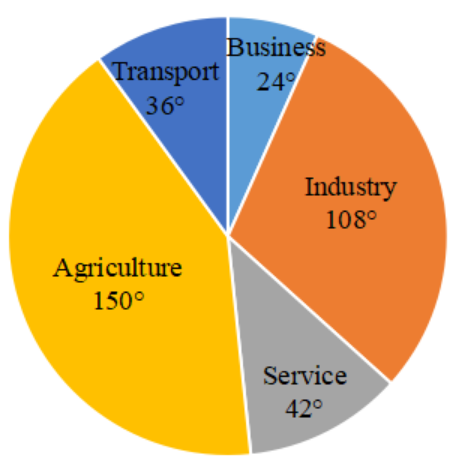
The pie-chart shows the distribution of the 5,00,040 employed people of a city according to their occupations in terms of the central angles of the sectors representing people engaged in the different occupations mentioned.
As per the information provided above, how many more people work in the service sector when compared to the number of people who engage themselves in business? |
24,492 25,684 25,000 25,002 |
25,002 |
Number of people work in the service sector = 42º Number of people are in business = 24º More number of people work in service sector to number of people in business = \(\frac{42º - 24º }{360º}\) × 5,00,040 = \(\frac{18º }{360º}\) × 5,00,040 = 2502 |