
From the graph given below, answer the following questions.
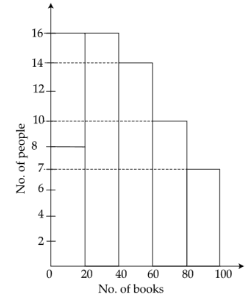
The total number of people surveyed is
Answer & explanation
Correct answer: option 4
The correct answer is Option (4) → 55
In this histogram each bar stands for one class of the number of books, and its height is the number of people in that class. Every person surveyed falls in one class only, so the total is the sum of all the bar heights.
0–20 books: 8 people
20–40 books: 16 people
40–60 books: 14 people
60–80 books: 10 people
80–100 books: 7 people
Total \(=8+16+14+10+7=55\)