CUET Preparation Today
Study the graph and answer the question.
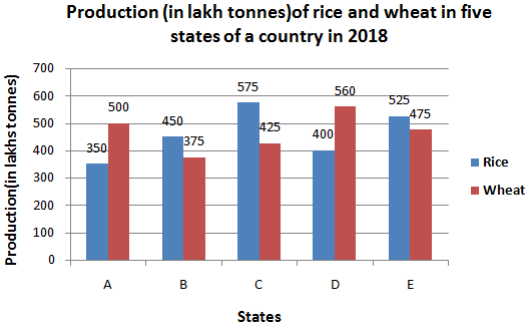
The number of states in which the production of wheat is more than 20% of the total production of rice in all five states is _______. |
4 3 1 2 |
3 |
Total production of Rice = 350 + 450 + 575 + 400 + 525 = 2300 Percentage of production of wheat in A to total production = \(\frac{500}{2300}\) × 100 = 21.7% Percentage of production of wheat in B to total production = \(\frac{375}{2300}\) × 100 = 16.3% Percentage of production of wheat in C to total production = \(\frac{425}{2300}\) × 100 = 18.47% Percentage of production of wheat in D to total production = \(\frac{560}{2300}\) × 100 = 24.3% Percentage of production of wheat in E to total production = \(\frac{475}{2300}\) × 100 = 20.6% So , 3 states has more than 20% of production.
|