
The figure shows the potential energy of the reacting system plotted against the reaction coordinate for the reaction \( \ce{H2(g) + I2(g) -> 2HI(g)} \).
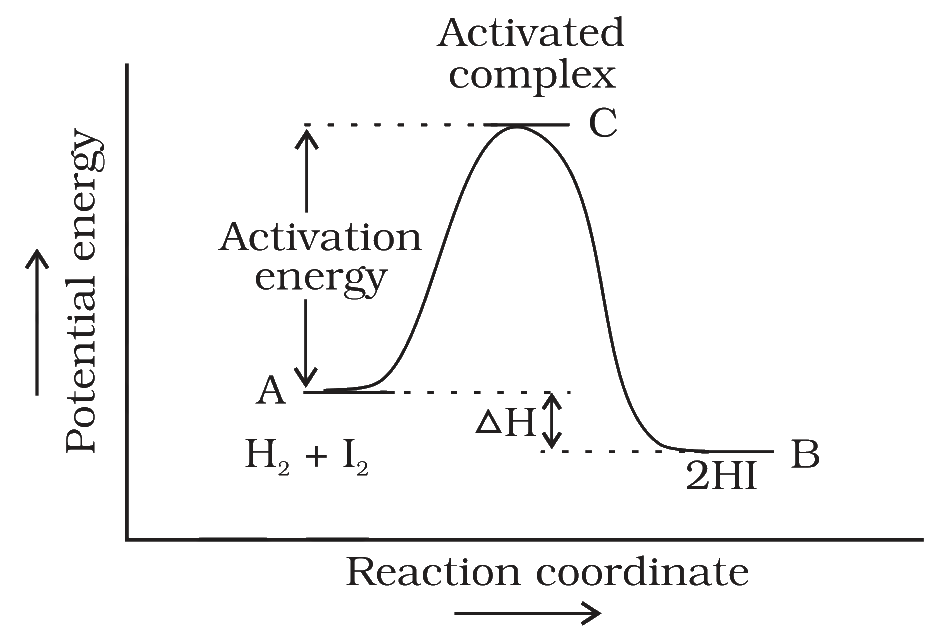
On this diagram, the activation energy of the reverse reaction, \( \ce{2HI(g) -> H2(g) + I2(g)} \), is equal to:
Answer & explanation
Correct answer: option 3
The correct answer is Option (3) → the activation energy marked in the figure plus the gap marked ΔH
The activation energy is the energy needed to form the activated complex (C) from the species that react. It is measured from the level of those species up to the top of the hump.
Forward reaction — H2 + I2 (A) → C. This climb is the activation energy marked in the figure.
Reverse reaction — 2HI (B) → C. The reverse reaction passes through the same activated complex C. In the figure, B lies below A by the gap marked ΔH. So 2HI must climb the gap ΔH to reach the level of A, and then the marked activation energy to reach C.
Ea(reverse) = Ea(marked) + gap marked ΔH
Why the other options are incorrect
Option (1) the activation energy marked in the figure — Incorrect. The marked arrow starts at A, the level of H2 + I2; the reverse reaction starts lower, at B.
Option (2) the activation energy marked in the figure minus the gap marked ΔH — Incorrect. Subtracting the gap would fit only if 2HI lay above H2 + I2; in the figure it lies below.
Option (4) the gap marked ΔH only — Incorrect. ΔH is the energy difference between reactants and products; it does not reach the top of the hump at C.
NCERT (2026-27 edition):
3.4 Temperature Dependence of the Rate of a Reaction – “The energy required to form this intermediate, called activated complex (C), is known as activation energy (Ea). Fig. 3.7 is obtained by plotting potential energy vs reaction coordinate. Reaction coordinate represents the profile of energy change when reactants change into products. Some energy is released when the complex decomposes to form products. So, the final enthalpy of the reaction depends upon the nature of reactants and products.”
Fig. 3.7: Diagram showing plot of potential energy vs reaction coordinate