CUET Preparation Today
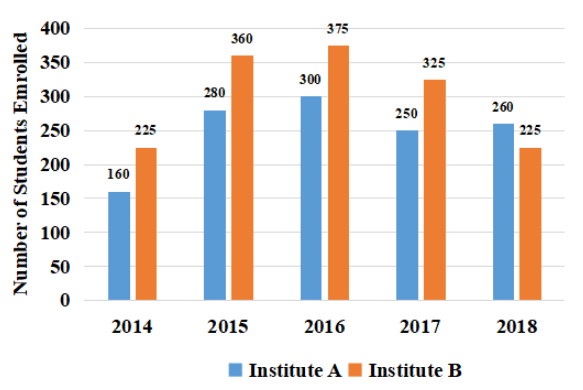
Bar graph shows the number of students enrolled for a vocational course in institutes A and B during 5 years.
The average number of students enrolled in institute A during 2014, 2016 and 2018 is what percent less than the number of students enrolled in institute B during 2017 (correct to two decimal places)? |
29.17% 32.75% 26.15% 22.46% |
26.15% |