CUET Preparation Today
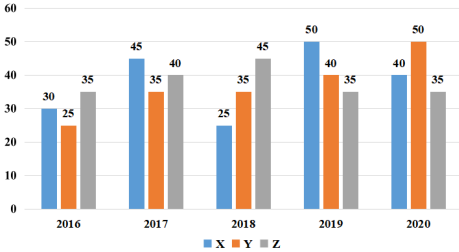
The bar graph given here shows the data of the production of cars by three different companies X, Y, Z over the years.
The average production for 5 years was maximum for which company/companies? |
Y and Z Y X and Y X and Z |
X and Z |
Average production of X = \(\frac{30 + 45 + 25 + 50 + 40 }{5}\) = \(\frac{190 }{5}\) = 38 Average production of Y = = \(\frac{25 + 35 + 35 + 40 + 50 }{5}\) = \(\frac{185 }{5}\) = 37 Average production of Z = = \(\frac{35 + 40 + 45 + 35 + 35 }{5}\) = \(\frac{190 }{5}\) = 38 So , X & Z have maximum average. |