CUET Preparation Today
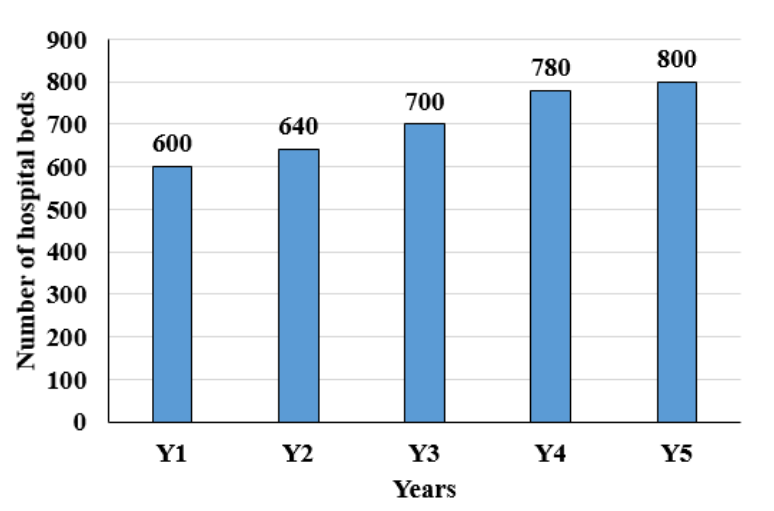
The following bar chart shows the number of hospital beds in a state in 5 consecutive years.
The number of hospital beds in Y6 will be 20% more than the number of such beds in Y5, and the number of hospital beds in Y7 will be 25% more than the number of such beds in Y6. What is the ratio of the number of hospital beds in Y2 to the number of hospital beds in Y7? |
16 : 31 8 : 15 2 : 7 4 : 7 |
8 : 15 |
20% = \(\frac{1}{5}\) & 25% = \(\frac{1}{4}\) Ratio of , Y5 : Y6 = 5 : 6 & Y6 : Y7 = 4 : 5 Overall , Y5 : Y6 : Y7 = 10 : 12 : 15 ATQ , 10R = 800 so , 15R = 1200 Ratio of Y2 : Y7 = 640 : 1200 = 8 : 15 |