
Study the graph given below, which shows the short run cost curves of a firm, and answer the questions that follow.
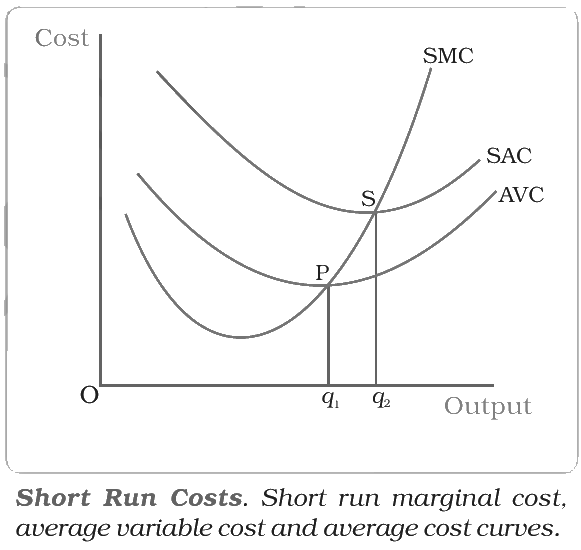
The SMC curve in the graph first falls and then rises. Which of the following explains this shape?
Answer & explanation
Correct answer: option 1
The correct answer is Option (1) → The marginal product of the variable factor first rises and then falls.
The SMC curve takes its shape from the law of variable proportions.
Option (1) The marginal product of the variable factor first rises and then falls. — Correct. While marginal product rises, each extra unit of output needs less of the factor, so SMC falls. Once marginal product falls, each extra unit needs more of it, so SMC rises.
Option (2) The average fixed cost keeps falling as output rises. — Incorrect. Marginal cost is the cost of one extra unit. Fixed cost does not change with output, so AFC plays no part in SMC.
Option (3) The price of the variable factor first falls and then rises. — Incorrect. The factor price is taken as given. SMC changes because the amount of the factor needed for each extra unit changes.
Option (4) Returns to scale first increase and then decrease. — Incorrect. Returns to scale is about raising all inputs in the same proportion, a long run idea. In the short run some inputs stay fixed.
NCERT (2026-27): “Shapes of the Short Run Cost Curves … Let us now look at the SMC curve. Marginal cost is the additional cost that a firm incurs to produce one extra unit of output. According to the law of variable proportions, initially, the marginal product of a factor increases as employment increases, and then after a certain point, it decreases. This means initially to produce every extra unit of output, the requirement of the factor becomes less and less, and then after a certain point, it becomes greater and greater. As a result, with the factor price given, initially the SMC falls, and then after a certain point, it rises. SMC curve is, therefore, ‘U’-shaped.” |