
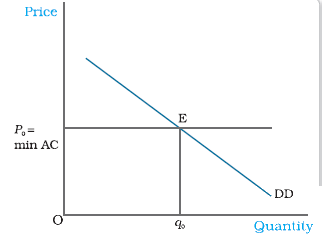
The diagram above shows market equilibrium in which of the following situations?
Answer & explanation
Correct answer: option 2
The correct answer is Option (2) → When free entry and exit of firms is allowed
The figure has a flat price line at p0 = min AC, and the market is in equilibrium where the demand curve DD meets it. The price sits at minimum average cost only when firms can enter and exit freely.
Entry wipes out any supernormal profit and exit wipes out any loss, so the price settles at minimum average cost. The quantity, q0, is then read off the demand curve.
NCERT (2026-27): “5.1.2 Market Equilibrium: Free Entry and Exit … From the above, it follows that the equilibrium price will be equal to the minimum average cost of the firms. In equilibrium, the quantity supplied will be determined by the market demand at that price so that they are equal. Graphically, this is shown in Figure 5.5 where the market will be in equilibrium at point E at which the demand curve DD intersects the p0 = min AC line such that the market price is p0 and the total quantity demanded and supplied is equal to q0.” |