CUET Preparation Today
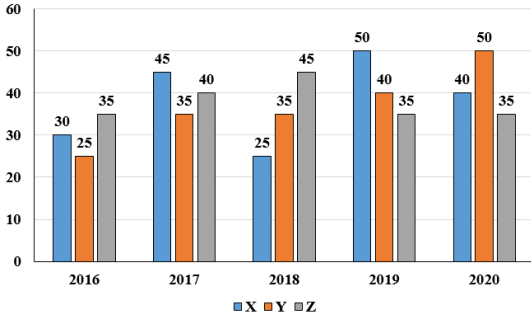
The bar graph given here shows the data of the production of cars by three different companies X, Y, Z over the years.
For which of the following years is the percentage rise/fall in the production from the previous year the maximum for company Y? |
2019 2018 2016 2017 |
2017 |
Percentage rise in production of Y in 2017 = \(\frac{10}{25}\) × 100 = 40% Percentage change in production of Y in 2018 = \(\frac{0}{35}\) × 100 = 0% Percentage rise in production of Y in 2019 = \(\frac{5}{35}\) × 100 = 14.28% Percentage rise in production of Y in 2020 = \(\frac{10}{40}\) × 100 = 25% Maximum Percentage rise in production of Y is in 2017 i.e 40% |