CUET Preparation Today
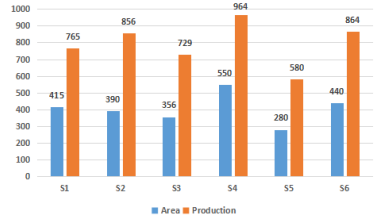
The following graph shows the area and production of S1 , S2 , S3 , S4 , S5 and S6.
Based on the information, the production ratio (production to land) is highest and lowest, respectively, in: |
S2, S1 S3, S6 S2, S4 S2, S3 |
S2, S4 |
Lets solve one by one for each option 1. S2 , S1 Production ratio for S2 and S1 = \(\frac{856 }{765}\) = 1.11 2. S3, S6 Production ratio for S3 and S6 = \(\frac{729 }{864}\) = 0.84 3. S2, S4 Production ratio for S2 and S4 = \(\frac{856 }{964}\) = 0.88 4. S2 , S3 Production ratio for S5 and S3 = \(\frac{856 }{729}\) = 1.17 So , Production ratio for S2 and S4 is lowest. Ans :- S2, S4
|