CUET Preparation Today
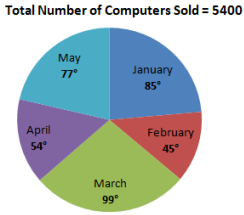
Study the pie chart and answer the question. Distribution (degree wise) of the number of computers sold by a shopkeeper during five months.
The number of months, in which the number of computers sold was above 20% of the total number of computers sold in 5 months, was: |
2 3 4 1 |
3 |
20% of the computers sold = \(\frac{1}{5}\) × 5400 = 1080 Computers sold in January = \(\frac{85}{360}\) × 5400 = 1275 Computers sold in February = \(\frac{45}{360}\) × 5400 = 675 Computers sold in March = \(\frac{99}{360}\) × 5400 = 1485 Computers sold in April = \(\frac{54}{360}\) × 5400 = 810 Computers sold in May = \(\frac{77}{360}\) × 5400 = 1155 So , computers sold in January , March & May are more than 20% of the computers sold . So , Ans :- 3 |