CUET Preparation Today
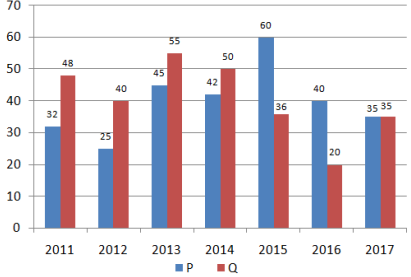
The Bar Graph shows the Profit (Rupees in Lakhs) earned by two companies P and Q during the period 2011 to 2017.
The ratio of average profit during the given period for Company P to Company Q is: |
284 : 257 257 : 284 284 : 279 279 : 284 |
279 : 284 |
Average profit of P : Average profit of Q \(\frac{32+25+45+42+60+40+35 }{7}\) : \(\frac{ 48+40+55+50+36+20+35}{7}\) \(\frac{ 279 }{7}\) : \(\frac{ 284}{7}\) 279 : 284
|