CUET Preparation Today
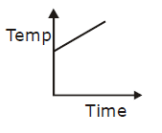
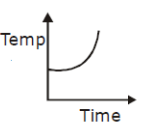
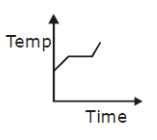
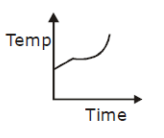
Liquid oxygen at 50 K is heated to 300 K at constant pressure of 1 atm. The rate of heating is constant. Which one of the following graphs represents the variation of temperature with time? |
|
|
While heating at initial, temperature will increase and then as there will be change of state from liquid to gas the temperature will remain constant. |