CUET Preparation Today
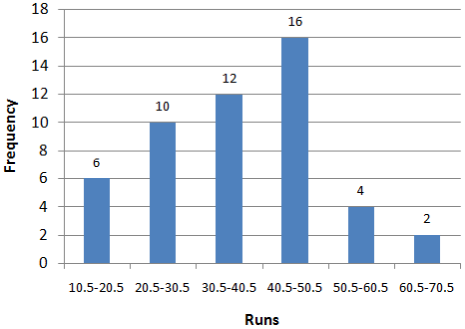
The given histogram represents the frequency distribution of average runs scored by 50 selected players from a district in a local cricket tournament.
What is the overall average score of the 50 players? |
29.3 37.1 32.6 38.5 |
37.1 |
Average score of 50 players = \(\frac{ 15.5× 6 + 25.5×10 + 35.5 × 12 + 45.5 × 16 + 55.5 × 4 + 65.5 × 2 }{50}\) = \(\frac{ 93 + 255 + 426 + 728 + 222 + 131}{50 }\) = \(\frac{ 1855 }{50 }\) = 37.1 |