CUET Preparation Today
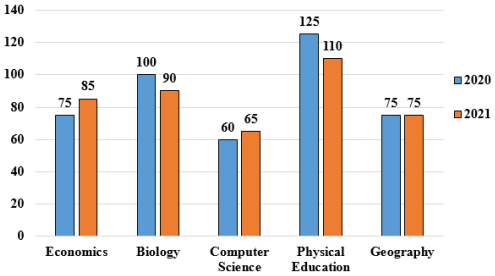
The following bar diagram shows the number of students who opted for the different subjects in the year 2020 and 2021.
Find the ratio of students opting Economics to students opting Physical Education in 2020. |
3 : 7 3 : 5 5 : 9 5 : 7 |
3 : 5 |
Students of Economic in 2020 : Students of Physical education in 2020 75 : 125 3 : 5 |