CUET Preparation Today
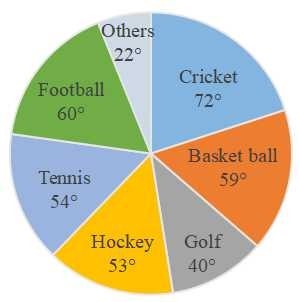
Study the given pie-chart and answer the question that follows. The pie-chart represents the spending of a state on various sports during a particular year.
How much percent more is spent on cricket than on tennis( correct up to 2 decimal places)? |
33.33% 32.75% 30.35% 28.25% |
33.33% |
Percentage of more spent on cricket than on tennis = \(\frac{72º - 54º }{54º}\) × 100 = \(\frac{1}{3}\) × 100 = 33.33% |