CUET Preparation Today
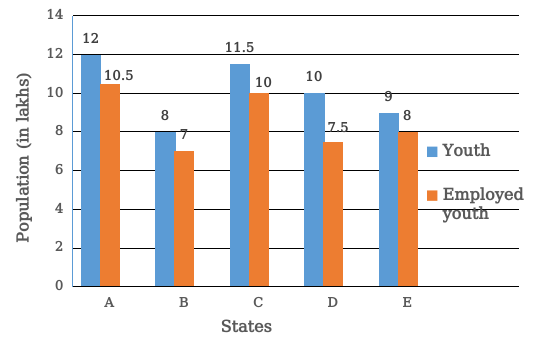
The following bar graph shows the total number of youth (in lakhs) and the number of employed youth (in lakhs) in 5 states A, B, C, D,E. The number of employed youth in state B is what percentage of the number of employed youth in state E ?
|
87% 85% 88.5% 87.5% |
87.5% |
Number of employed youth in state B = 7 Number of employed youth in state E = 8 Required percentage = \(\frac{7}{8}\) × 100 = 87.5% |