CUET Preparation Today
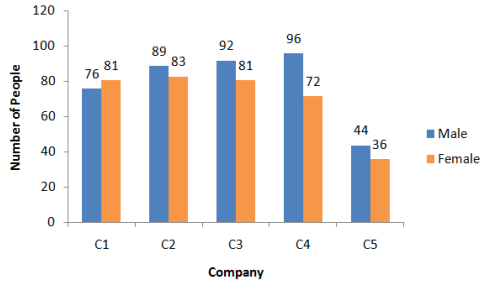
The Bar graph given below presents the number of males and females working in five different companies.
What is the ratio of the total number of males working in the Companies C2 and C3 to the total number of females working in C1 and C5? |
181 : 117 182 : 119 183 : 124 171 : 136 |
181 : 117 |
Number of males working in C2 and C3 : Number of females working in C1 and C5 ( 89 + 92 ) : ( 81 + 36 ) 181 : 117 |