CUET Preparation Today
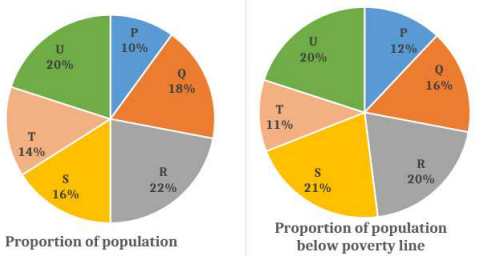
The given pie charts show the proportion of the population and the proportion of population below poverty line of six towns P, Q, R, S, T and U in 2018. Study the pie charts and answer the question that follows.
If the population of the town 'U' is 12,00,000 then the population below poverty line of town 'P' is: |
74000 68000 56000 72000 |
72000 |
Population of U = 12% of total population Total population = \(\frac{100}{20}\) × 1200000 = 6000000 Population of P = \(\frac{10}{100}\) × 6000000 = 600000 Population of P below poverty line = \(\frac{12}{100}\) × 600000 = 72000 |