CUET Preparation Today
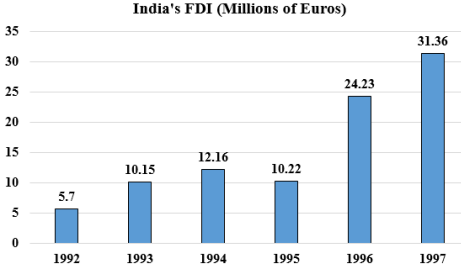
The following bar chart shows the vends of foreign direct investment (FDI) into India from all over the world.
For which year is the per cent increase in FDI over the previous year the highest? |
1997 1994 1996 1993 |
1996 |
By solving one by one for each option , 1. 1997 Percent increase in FDI = \(\frac{31.36 - 24.23}{24.23}\) × 100 = \(\frac{ 7.13}{24.23}\) × 100 = 29.42% 2. 1994 Percent increase in FDI = \(\frac{12.16 - 10.15}{10.15}\) × 100 = \(\frac{ 2.01}{10.15}\) × 100 = 19.80% 3. 1996 Percent increase in FDI = \(\frac{24.23 - 10.22}{10.22}\) × 100 = \(\frac{14.01}{10.22}\) × 100 = 137.08% 4. 1993 Percent increase in FDI = \(\frac{10.15 - 5.7}{5.7}\) × 100 = \(\frac{ 4.45}{5.7}\) × 100 = 78.07% So , Percent increase in FDI is maximum in 1996 . |