CUET Preparation Today
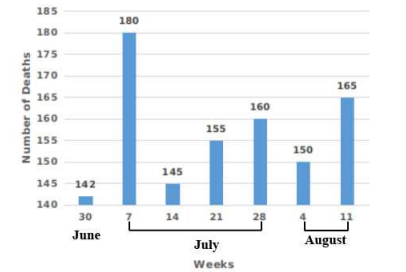
The following bar graph shows the number of deaths from road accidents occurred during the rainy season in the year 1992. Study the graph carefully and answer the question.
Between which two consecutive weeks was the fall in the number of deaths the greatest |
21 July to 28 July 14 July to 21 July 4 August to 11 August 30 July to 7 July |
30 July to 7 July |
Lets solve one by one for each option . 1. 21 July to 28 July There is increase in number of deaths as we move forward. 2. 14 July to 21 July There is increase in number of deaths as we move forward. 3. 4 August to 11 Ausgust There is increase in number of deaths as we move forward 4. 30 June to 7 July Number of deaths in 30 June week = 180 Number of deaths in 7 July week = 142 Fall in number of deaths = 180 - 145 = 38 So , Highest fall in number of deaths appear in 30 June to 7 July weeks. |