CUET Preparation Today
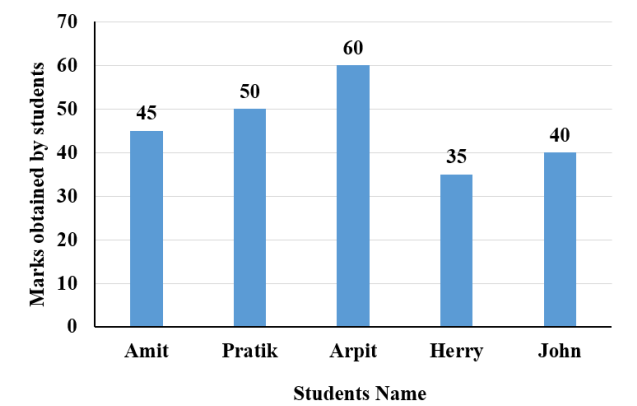
The following bar graph shows the marks obtained by 5 students of a class. What is the difference between the highest and the lowest marks?
|
25 60 35 15 |
25 |
Highest marks = 60 Lowest marks = 35 Difference b/w highest and lowest marks = 60 - 35 = 25
|