
Study the given graph and answer the question that follows.
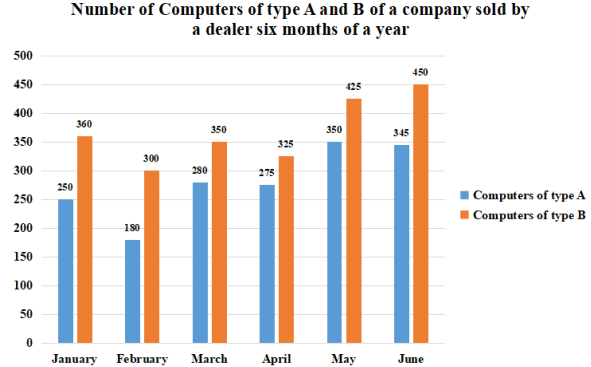
The ratio of the total number of computers of type A sold in February, April and June to the total number of computers of type B sold in April and May is:
Answer & explanation
Correct answer: option 1
Total number of computers of type A sold in February, April and June : Total number of computers of type B sold in April and May
(180 + 275 + 345 ) : ( 325 + 425 )
800 : 750
16 : 15