CUET Preparation Today
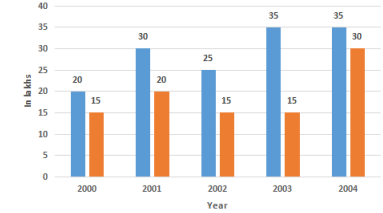
In the given bar graph, the blue bar shows the income and the orange bar shows the expenditure of a company. Study the graph and answer the question that follows.
The income in 2001 was equal to the expenditure in the year: |
2002 2003 2000 2004 |
2004 |
Income in year 2001 = 30 By carefully observing the graph. We find that expenditure in year 2004 is also 3 . Ans :- 2004 |