CUET Preparation Today
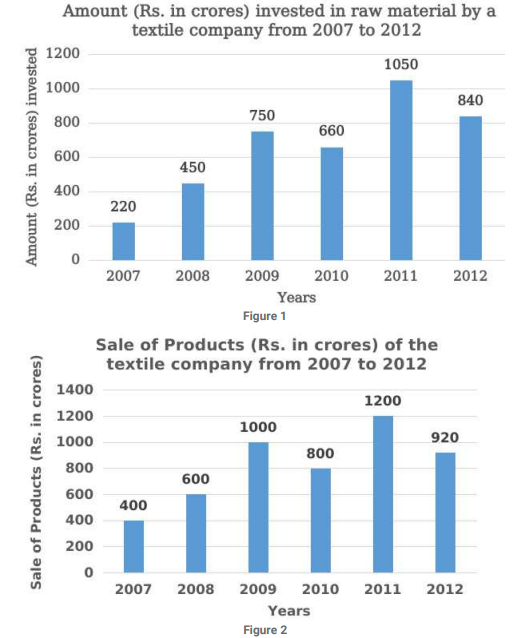
Study the given bar graphs and answer the question that follows. The bar graphs represent the amount invested in raw materials (in ₹ crore) and the sale of the products, by a textile company in the years 2007— 2012. The X-axis represents the years. The Y-axis represents the amount invested in raw materials (in ₹ crore) in figure 1 and sale of products in figure 2, respectively.
In which year was there a maximum percentage increase in the sales of products as compared to the previous year? |
2008 2010 2009 2011 |
2009 |
Lets solve one by one for each option . 1. 2008 Percentage increase in sales in 2008 compared to the previous year = \(\frac{600-400 }{400}\) × 100 = \(\frac{200 }{400}\) × 100 = 50% 2. 2010 In 2010 there is decrease in sales as compared to previous year. 3. 2009 Percentage increase in sales in 2009 compared to the previous year = \(\frac{1000-600 }{600}\) × 100 = \(\frac{400 }{600}\) × 100 = 66.67% 1. 2011 Percentage increase in sales in 2011 compared to the previous year = \(\frac{1200-800 }{800}\) × 100 = \(\frac{400 }{800}\) × 100 = 50% So , percentage increase in sales in 2009 is maximum as compared to previous year. Ans :- 2009
|