CUET Preparation Today
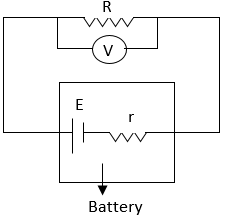
In an experiment, a student in the laboratory measures the terminal potential difference (V) of a cell (emf E and internal resistance r) as a function of current I flowing through it and plot a graph taking V on y-axis and I on x-axis. What is the slope of the graph between V and I? |
$r^2$ $-r^2$ $r$ $-r$ |
$-r$ |
The correct answer is Option (4) → $-r$
The terminal potential difference (v) of a cell is related to its emf (E), current (I), and internal resistance (r) by - $V=E-Ir$ [By Ohm's law] This is a linear equation of the form $V=-Ir+E$ [$y=mx+c$] where, $-r$ is the slope. |