CUET Preparation Today
Study the given bar-graph and answer the question that follows.
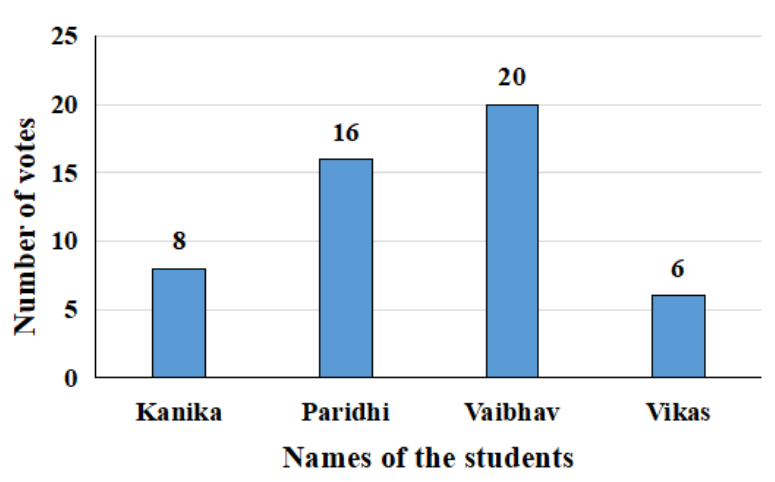
In percentage figures how many more votes did Vaibhav get than Paridhi? |
25 percent 10 percent 20 percent 4 percent |
25 percent |
Number of votes Vaibhav get = 20 Number of votes Paridhi get = 16 Percent of more votes get by Vaibhav than Paridhi = \(\frac{20 - 16 }{16}\) × 100 = \(\frac{1 }{4}\) × 100 = 25% |