
The bar graph shows the number of youth (in lakhs, plain bars) and the number of employed youth (in lakhs, hatched bars) in five states A, B, C, D and E.
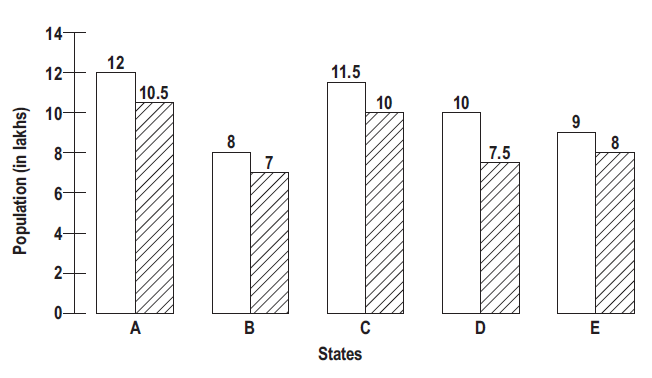
In which state are the employed youth between 70% and 80% of the total youth of the state?
Answer & explanation
Correct answer: option 3
The correct answer is Option (3) → D
For each state, employed youth ÷ total youth × 100 gives the percentage employed; only one state falls between 70% and 80%.
A: \(\displaystyle\frac{10.5}{12}\times100=87.5\%\)
B: \(\displaystyle\frac{7}{8}\times100=87.5\%\)
C: \(\displaystyle\frac{10}{11.5}\times100\approx86.96\%\)
D: \(\displaystyle\frac{7.5}{10}\times100=75\%\)
E: \(\displaystyle\frac{8}{9}\times100\approx88.89\%\)
Only D lies between 70% and 80%.