CUET Preparation Today
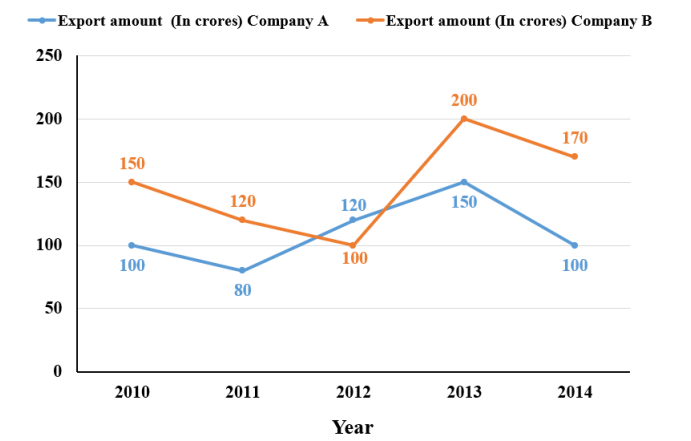
The following line graph shows the export by company A and company B (in crores) over the five years 2010 to 2014. In which year, the difference between the export from company A and company B was maximum? ( Currency is Indian rupees.)
|
2014 2011 2012 2013 |
2014 |
Lets check one by one for each option. 1. 2014 Difference in export of company A & B = 170 - 100 = 70 2. 2011 Difference in export of company A & B = 120 - 80 = 40 3. 2012 Difference in export of company A & B = 120 - 100 = 20 4. 2013 Difference in export of company A & B = 200 - 150 = 50 Maximum difference is 70 which is for year 2014. |