CUET Preparation Today
In graphical representation, how is the aggregate demand function obtained? |
By adding the consumption and investment functions vertically. By adding the consumption and investment functions horizontally. By subtracting the consumption function from investment functions. By multiplying the consumption and investment functions. |
By adding the consumption and investment functions vertically. |
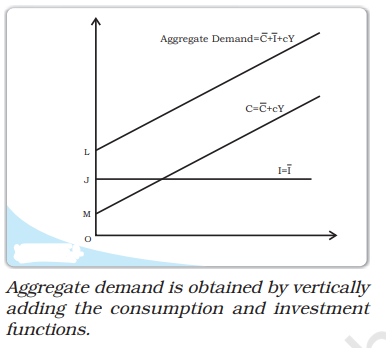
The correct answer is Option (1) → By adding the consumption and investment functions vertically. In a simple two-sector (household and firm) Keynesian model of income determination, aggregate demand (AD) is the sum of consumption expenditure (C) and investment expenditure (I).
Here, OM = $\bar C$ OJ = $\bar I$ OL = $\bar C$ + $\bar I$ The aggregate demand function is parallel to the consumption function i.e., they have the same slope c.
|