CUET Preparation Today
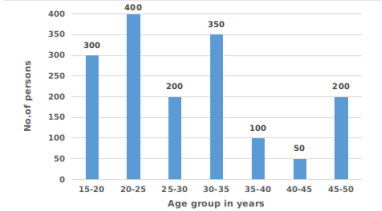
Study the following histogram and answer the given question. A study was made for the number of persons of different age group visited in a library in a week which is shown in given in the histogram. Study the histogram and answer the question given below.
What percent of the total number of persons visiting library in the week was the number of persons of age group 25-30 years? |
12% 15% 12.5% 10.5% |
12.5% |
Total number of persons visiting library = 300 + 400 + 200 + 350 + 100 + 50 + 200 = 1600 Number of person visiting library of age group 25 - 30 years = 200 Required percentage = \(\frac{200 }{1600 }\) × 100 = \(\frac{1}{8 }\) × 100 = 12.5% |