CUET Preparation Today
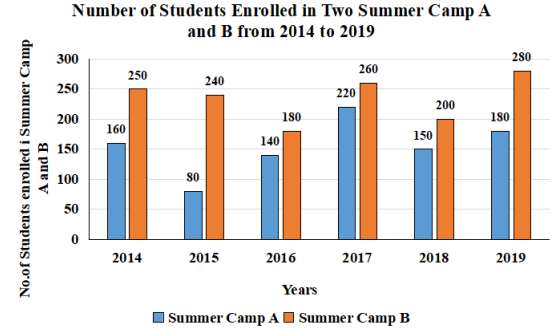
The following Bar Chart shows the number of students enrolled in two Summer Camps A and B from 2014 to 2019. Study the cha11s carefully and answer the question that follows:
For the years 2014 to 2019, what is the ratio of the total number of students enrolled for Summer Camp A to that for Summer Camp B? |
47 : 31 31 : 47 41 : 37 37 : 41 |
31 : 47 |
Total students in camp A : Total students in camp B ( 160+80 + 140+220+150+180 ) : ( 250+240+180+260+200+280 ) 930 : 1410 31 : 47 |