CUET Preparation Today
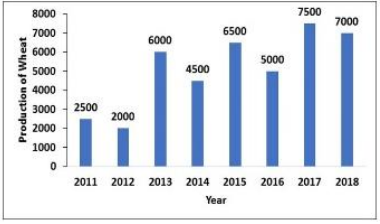
The Bar graph given below presents the production of wheat (in tonnes) by a big farm during the years 2011-2018. In how many of the given years was the production of wheat greater than the average production of the period?
|
4 2 3 5 |
4 |
Average production over all years = \(\frac{2500+2000+6000+4500+6500+5000+7500+7000 }{8}\) = \(\frac{ 41000 }{8}\) = 5125 Production of wheat in year 2013 , 2015 , 2017 & 2018 is greater than average production of all years. Ans :- 4 |