CUET Preparation Today
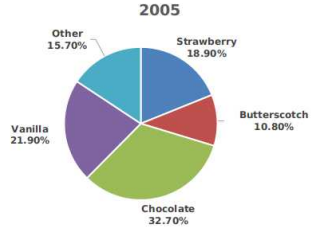
The given pie chart represents the popularity of ice-cream flavours in the year 2005.
In 2005, if 40% of the ‘other’ category is mix fruit flavour and 1570 people surveyed preferred mix fruit flavour, then how many people were surveyed? |
25,000 75,000 10,000 50,000 |
25,000 |
40% of 15.70% of total flavours = 1570 Total flavours = \(\frac{5}{2}\) × \(\frac{100}{15.70}\) × 1570 = 25000
|