CUET Preparation Today
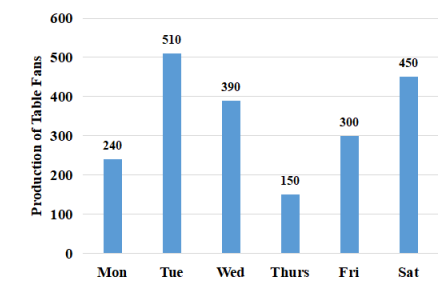
Study the given bar graph and answer thee question that follows. The bar graph shows the production of table fans in a factory during one week.
The average production of table fans on Friday and Saturday exceeds the average production of table fans during the week by: |
45 30 35 40 |
35 |
Average production of table fans during this week = \(\frac{240 + 510+390+150+300+450 }{7}\) = \(\frac{ 2040 }{6}\) = 340 Average production of table fans on Friday and Saturday = \(\frac{300 + 450 }{2}\) = \(\frac{ 750 }{2}\) = 375 Difference b/w average production of table fans on Friday and Saturday and Average production of table fans during this week = 375 - 340 = 35 |