CUET Preparation Today
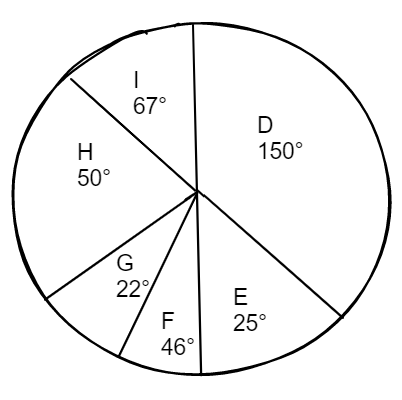
The pie chart given below shows the number of trucks manufactured by Six companies in a year. Total trucks manufactured by all these Six companies are 1800. Number of trucks manufactured by a particular company company is shown in terms of degree with respect to the total number of trucks is manufactured by all Six companies.
Number of trucks manufactured by D and F together is what percent of the number of trucks manufactured by G and I together? |
140.2 percent 220.2 percent 260.4 percent 234.3 percent |
220.2 percent |
Number of trucks manufactured by D and F together = $\frac{degree}{360°}$ x Total number = $\frac{196°}{360°}$ x 1800 = 196 x 5 = 980 Number of trucks manufactured by G and I together = $\frac{degree}{360°}$ x Total number = $\frac{89°}{360°}$ x 1800 = 445 Number of trucks manufactured by D and F is $\frac{980}{445}$ x 100% = 220.2 % of the trucks manufactured by G and I together |